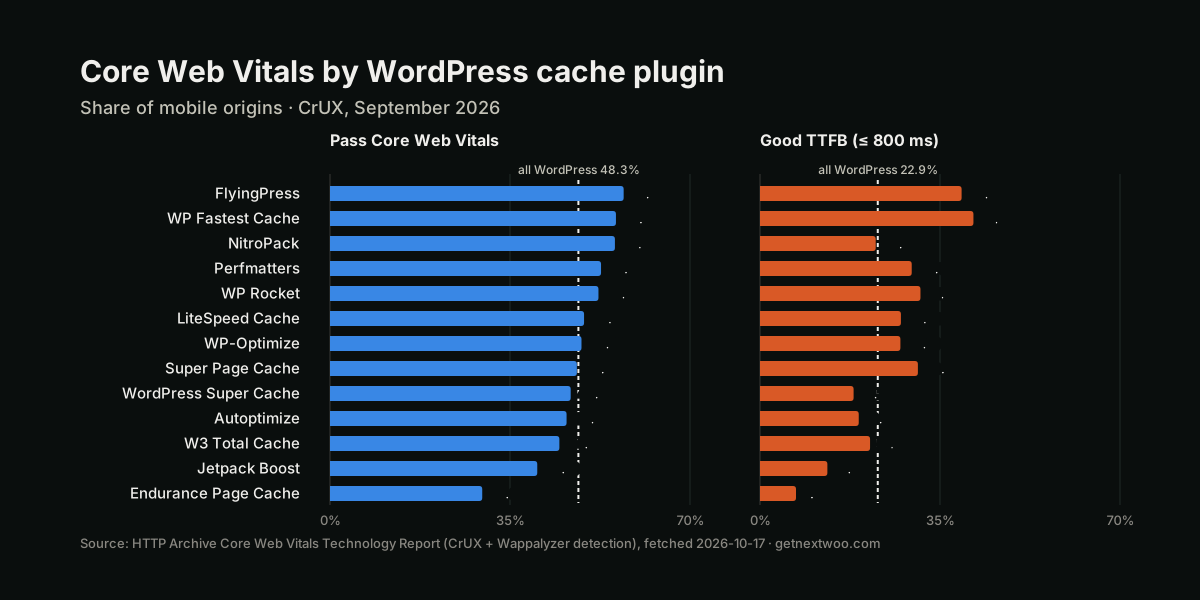
In the September 2026 Chrome UX Report (CrUX), WordPress sites running WP Rocket pass Core Web Vitals on mobile at 52.2%. Sites on NitroPack pass at 55.4%, sites on LiteSpeed Cache at 49.4%, and WordPress as a whole at 48.3%. Those figures cover 247,091, 10,693 and 376,650 origins measured on real Chrome visits, grouped by the HTTP Archive Core Web Vitals Technology Report according to the plugin each site runs.
The verdict first. The data is strongest for WP Rocket and LiteSpeed Cache, because their samples are enormous, and what it says about them is modest: a 3.9-point and a 1.1-point edge over WordPress overall, gone entirely among the top 1 million sites. The highest rows, FlyingPress and NitroPack, rest on far smaller samples and shrink the same way. None of this says “install X”. It says which kind of site installs X, and the rest of this article is about telling those two apart.
Pass rates for 14 cache and optimization plugins
To pass, three-quarters of a site's Chrome page loads need good scores on all three Core Web Vitals: LCP within 2.5 s, INP within 200 ms, CLS no higher than 0.1. Mobile pass rates, with the number of origins measured in brackets:
- Above 55%: FlyingPress 57.1% (4,701), WP Fastest Cache 55.6% (39,671), NitroPack 55.4% (10,693)
- Between 51% and 53%: Perfmatters 52.7% (16,792), WP Rocket 52.2% (247,091), Redis Object Cache 51.5% (59,824)
- Within a point of all WordPress, which sits at 48.3% (2,658,175): LiteSpeed Cache 49.4% (376,650), WP-Optimize 48.9% (46,733), Super Page Cache 48.0% (7,214)
- Below the WordPress figure: WP Super Cache 46.8% (82,159), Autoptimize 46.0% (75,445), W3 Total Cache 44.6% (78,450), Jetpack Boost 40.3% (12,068)
- Last by a wide margin: Endurance Page Cache, the cache Bluehost installs on its WordPress plans, at 29.6% (26,716)
Desktop barely reorders the top. WP Rocket passes at 54.5% there, NitroPack at 57.2%, LiteSpeed Cache at 52.2% and WordPress at 53.7%. Two more plugins are detected, FastPixel on 343 sites and BerqWP on 227. That is too few to rank, so they stay in the published CSV and out of this list.
WP Rocket vs NitroPack vs LiteSpeed Cache, metric by metric
The headline pass rate hides where each plugin's sites differ. Mobile shares rated good, in the order WP Rocket, NitroPack, LiteSpeed Cache:
- LCP: 63.2%, 68.8% and 57.7%, against 55.4% for WordPress; the widest spread of any metric
- INP: 87.5%, 88.1% and 86.0%, all three below the 90.3% WordPress figure
- CLS: 85.3%, 83.7% and 87.3%, against 87.3%, so layout shift separates nothing
- TTFB: 31.2%, 22.5% and 27.4%, against 22.9% for WordPress
NitroPack is the odd one. Its sites have the best LCP of the three and the worst server response, level with WordPress overall. Whatever NitroPack does for them happens after the first byte arrives: the median NitroPack page weighs 1.57 MB on mobile against 2.72 MB for WordPress, and its median Lighthouse performance score is 64 against 43. The INP line points somewhere else entirely. All three plugins sit below WordPress on interactivity, which is what you would expect if caching does nothing for it.
LiteSpeed Cache comes out worse than the other two: the largest sample and the smallest lift, with an LCP share only 2.3 points above WordPress. Do not read that as a weak plugin. It is free, and its page cache runs on LiteSpeed web servers, so its row is shaped by whoever buys LiteSpeed hosting rather than by a deliberate choice of cache.
Selection bias: Perfmatters has no page cache and still shows faster servers
Perfmatters is the cleanest test in the dataset. It disables scripts and styles page by page and has no page cache, so it cannot change how fast a server answers. Sites running it still have good TTFB 29.5% of the time against 22.9% for WordPress. That 6.6-point lead belongs to the owners, not the plugin: people who buy Perfmatters have usually already paid for decent hosting and a cache, and the row measures their whole setup.
Site size tells a related story. CrUX ranks origins by Chrome traffic, and 10.4% of Perfmatters sites and 11.7% of Redis Object Cache sites rank in the top 1 million, against 4.1% of all WordPress sites. NitroPack (4.3%) and WP Rocket (5.8%) sit near the WordPress figure. That rules out the easy explanation for NitroPack's lead, that its users run smaller and simpler sites; by traffic they look like WordPress overall.
Restrict the comparison to the top 1 million and the plugin advantage disappears. WordPress passes at 50.1% there across 110,537 sites. WP Rocket sites pass at 48.3% (14,482), LiteSpeed Cache at 49.6% (19,612) and NitroPack at 45.6% (472). Busy WordPress sites without a detected cache plugin are often on managed hosts with server-level caching that this report cannot see, so even this cut compares setups rather than plugins.
Endurance Page Cache shows the bias from the other side. Worldwide it passes at 29.6%. For Chrome users in the United States it passes at 61.1%, within a point of the US WordPress figure of 62.0%. The plugin is identical in both numbers. What changes is the distance between the visitor and the server: Endurance sites have good TTFB for 17.7% of US visitors and 8.4% of Australian ones.
TTFB is where a page cache should show
A full-page cache skips the PHP and database work for a request. That shortens time to first byte and helps LCP only through it, so TTFB is the fair test of a cache plugin. Good TTFB means 800 ms or less at the 75th percentile, and the shares are: WP Fastest Cache 41.5%, FlyingPress 39.2%, WP Rocket 31.2%, Super Page Cache 30.7%, LiteSpeed Cache 27.4%, W3 Total Cache 21.4%, WP Super Cache 18.2%. WordPress overall is at 22.9%.
Even the best row leaves about six sites in ten outside the good range. CrUX measures TTFB from the start of navigation, so redirects, DNS lookup, connection setup and every cache miss count against it, and a page cache shortens only the server's share. Two long-established page caches, W3 Total Cache and WP Super Cache, sit below the WordPress figure. The data cannot say why. A plausible reason is that both are free defaults on cheap shared hosting, which is a hypothesis, not a measurement.
For scale, sites detected on WP Engine pass at 64.9% (81,352 sites) and on Kinsta at 58.3% (31,077), ahead of every cache plugin with more than 5,000 sites. Both hosts cache pages at the server, and both serve larger businesses, so the selection caveat applies there with more force. Our notes on WooCommerce hosting cover what to check below the plugin layer.
LCP images and INP are not cache problems
Once the HTML arrives, the cache's job is done. LCP then depends on how soon the browser finds and downloads the largest image. That is a theme and image question, covered in our product image guide. INP depends on how much JavaScript runs on the main thread when someone taps a filter or an add-to-cart button, and the WooCommerce INP guide goes through the usual sources. In this dataset INP is the one metric where every large cache-plugin row trails WordPress overall, by 2.8 points for WP Rocket and 4.3 for LiteSpeed Cache.
The longer argument about where caching runs out on a store is in why WP Rocket is not enough. The theme, image and script work that comes after the plugin is what our WooCommerce speed optimization service does.
Pass rates for US, UK, Canadian, Australian and German visitors
The CrUX country datasets measure the experience of Chrome users located in each country, wherever the server is. Mobile pass rates, in the order WordPress, WP Rocket, LiteSpeed Cache, NitroPack:
- United States: 62.0%, 62.4%, 63.5% and 73.9%, with 4,042 NitroPack sites measured
- United Kingdom: 66.3%, 69.5%, 71.6% and 73.1%, on 858 NitroPack sites
- Canada: 66.9%, 72.5%, 72.8% and 77.9%, on 553 NitroPack sites
- Australia: 50.2%, 56.1%, 52.0% and 62.2%, on 500 NitroPack sites
- Germany: 63.1%, 69.7%, 61.5% and 67.9%, on 424 NitroPack sites
In the United States, the largest slice, WP Rocket sites pass at the WordPress rate to within half a point. NitroPack leads in four of the five countries. Outside the US its samples are small enough that the margin of error runs from about ±3 to ±4.5 points, so the Germany result is a tie with WP Rocket. Every country figure is higher than the global one, because a site only enters a country's dataset with enough visitors from there. Compare plugins inside one country, never a country with the global table.
Two years of CrUX data, September 2024 to September 2026
Every row rose over the two years, which makes it hard to credit the plugins with any of it. WordPress went from 42.5% to 48.3%. WP Rocket went from 47.2% to 52.2%, so its lead over WordPress narrowed from 4.7 points to 3.9. LiteSpeed Cache climbed from 43.2% to 49.4% and NitroPack from 50.3% to 55.4%.
TTFB went the other way. WP Rocket's good-TTFB share fell from 34.4% to 31.2% and LiteSpeed Cache's from 32.0% to 27.4%, while WordPress slipped from 24.5% to 22.9%. The pass-rate gains came from LCP, INP and CLS, which all improved, not from servers answering faster.
The samples moved too. Sites with WP Rocket detected fell from 359,945 to 247,091, a 31% drop, and NitroPack from 16,661 to 10,693. LiteSpeed Cache grew from 355,632 to 376,650 and overtook WP Rocket as the most-detected cache plugin in October 2024. Whether that is churn or a change in how the plugins mark their HTML, aggregate data cannot tell.
Limits: coverage, detection and the one-technology API
CrUX only includes origins with enough Chrome traffic, so a small store is in none of these rows. Detection uses Wappalyzer-based rules that read the page, its headers and asset paths. A plugin that leaves no fingerprint is missed, and detection says nothing about how a plugin is configured.
The API reports one technology at a time. So there is no row for WP Rocket on WooCommerce stores, no way to drop sites that run two cache plugins at once, and no control for the host. Every plugin row is all WordPress sites using it. Stores are covered in our WooCommerce Core Web Vitals statistics, where the mobile pass rate is 39.3%. NitroPack also sells connectors for platforms other than WordPress, and the report files it under Caching and Performance rather than WordPress plugins, so its row may include non-WordPress sites.
Small rows carry wide error bars. At 4,701 sites FlyingPress is good to about ±1.4 points; NitroPack's 472 top-1M sites, to about ±4.5.
Method and how to re-check a figure
Every number comes from cdn.httparchive.org/v1, the keyless API behind the HTTP Archive Core Web Vitals Technology Report, fetched on 2026-10-17 for the September 2026 CrUX dataset. HTTP Archive detects technologies on each crawled origin and joins them to CrUX field data. Pass rates are good origins divided by measured origins, rounded to one decimal, and a site with too few INP samples is scored on the other two metrics. Plugins were taken from the report's Caching, Performance and WordPress plugins categories. SiteGround's Speed Optimizer, Cloudflare APO, Hummingbird and Breeze are not detected, so they have no row. To verify the NitroPack and WordPress rows yourself, request /v1/cwv?technology=NitroPack,WordPress&geo=ALL&rank=ALL&start=2026-09-01.
What the data supports doing with your own cache plugin
Keep the cache plugin you have. Switching from WP Rocket to NitroPack, or back, buys at most the few points between their rows, and the top-1M cut suggests even those belong to the sites. Check your own origin first: PageSpeed Insights and our store speed check read the same CrUX field data. A red TTFB means the page is not being served from cache or the host is the ceiling. A green TTFB next to a red LCP puts the problem in the theme or the images, out of reach for any plugin that only stores HTML.
The exception is a site with no page cache at all on plain shared hosting. Going from no cache to any cache is a change these rows do not measure, and it remains the cheapest TTFB fix to try.